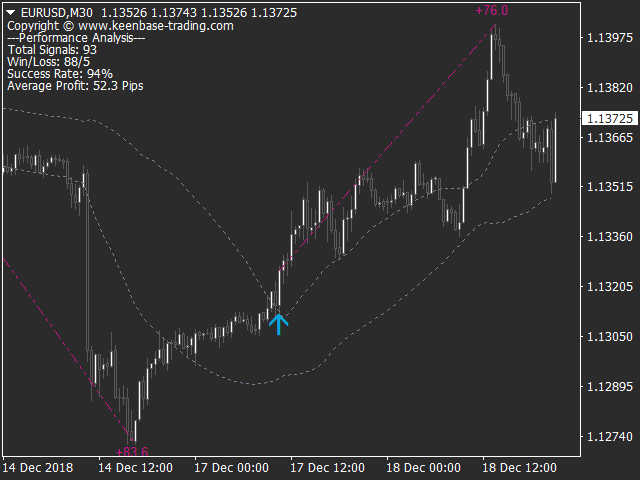
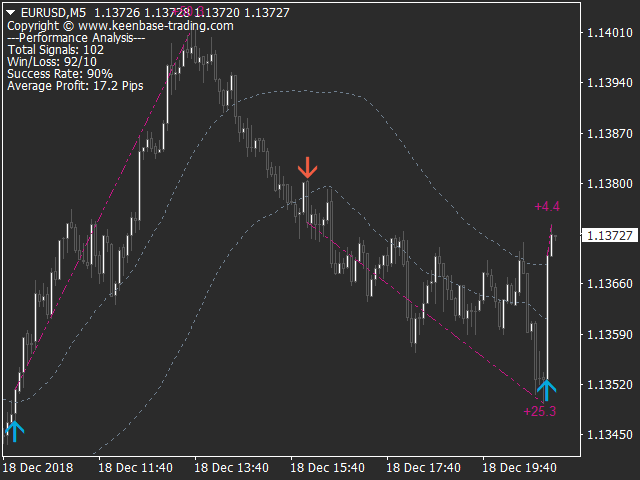
KT Momentum Arrows is a professional momentum breakout indicator for MetaTrader 4 that identifies strong buying and selling opportunities using price volatility and dynamic band deviation.
The indicator automatically generates BUY signals when price closes above the upper volatility band and SELL signals when price closes below the lower band, helping traders capture strong market momentum at the beginning of potential trends.
Unlike repainting indicators, KT Momentum Arrows produces non-repainting signals, making it reliable for historical analysis, strategy testing, and live trading.
Official Information
Indicator Name: KT Momentum Arrows
Platform: MetaTrader 4 (MT4)
Category: Momentum Indicator / Breakout Indicator
Version: Latest
Official Website: MQL5 Marketplace
Official Price: Check Official Website $75
SFXLAB Price: FREE
License Educational Purpose
Key Features
- Non-Repainting BUY & SELL Signals
- Momentum Breakout Detection
- Volatility-Based Signal Generation
- Dynamic Band Deviation
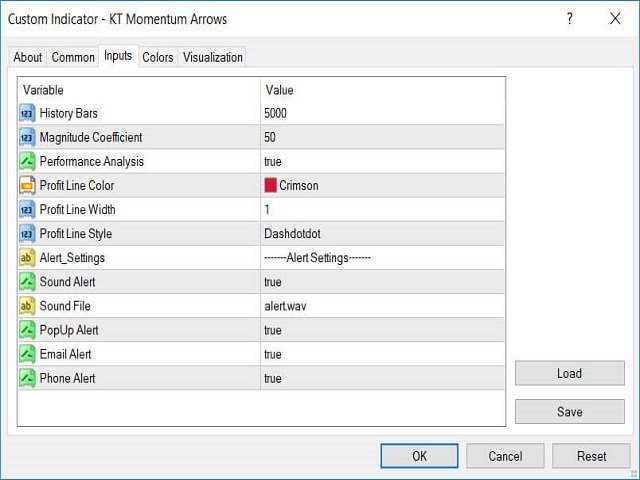
- Adjustable Magnitude Coefficient
- Performance Statistics
- Win/Loss Analysis
- Success Rate Calculation
- Average Profit Analysis
- Popup Alerts
- Email Notifications
- Push Notifications
- Sound Alerts
- Suitable for Multiple Trading Styles
Best For
- Momentum Traders
- Breakout Traders
- Day Traders
- Swing Traders
- Scalpers
Indicator Settings
- Signal Settings
- Magnitude Coefficient
- History Bars
- Signal Generation
- Performance Analysis
- Win/Loss Statistics
- Success Rate
- Average Profit
- Profit Trend Lines
- Alerts
- Popup Alerts
- Email Alerts
- Push Notifications
- Sound Alerts
Frequently Asked Questions
Does KT Momentum Arrows repaint?
No. All signals are confirmed after candle close and remain permanently on the chart.
What generates BUY and SELL signals?
BUY signals appear when price closes above the upper volatility band, while SELL signals appear when price closes below the lower band.
What is the Magnitude Coefficient?
It controls the sensitivity of the volatility bands and directly affects signal frequency.
Is it suitable for scalping?
Yes. It can be used for scalping, day trading, swing trading, and momentum trading.
Does it include performance analysis?
Yes. The indicator provides historical statistics, including Win/Loss ratio, Success Rate, and Average Profit.